ChatGPT Reviews Analysis with Python
Analyzing reviews is one of the best data-driven strategies to improve your product or services. It helps in understanding what people think about your product, what they don’t like about it, and what more they expect from it. So, if you want to understand how to analyze reviews to understand what people think about your product, this article is for you. In this article, I’ll take you through the task of ChatGPT reviews analysis with Python, which will help us understand how to analyze reviews to understand what people think about ChatGPT.
ChatGPT Reviews Analysis with Python
The dataset I am using to analyze the reviews of ChatGPT consists of user reviews of ChatGPT, including textual feedback, ratings, and review dates. You can download the dataset from here.
Let’s get started with this task by importing the necessary Python libraries and the dataset:
import pandas as pd
import plotly.graph_objects as go
from sklearn.feature_extraction.text import CountVectorizer
from collections import Counter
import plotly.express as px
import plotly.io as pio
pio.templates.default = "plotly_white"

# load the dataset
df = pd.read_csv("chatgpt_reviews.csv")

df.head()
Let’s have a look at whether the dataset has any null values or not:
df.isnull().sum()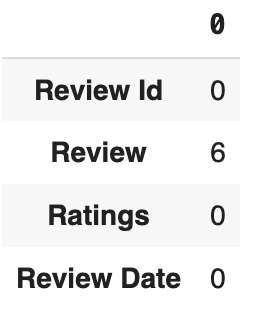
The dataset has some null values in the review column. I’ll replace all the null values with empty strings so that the null values don’t affect the analysis:
df['Review'] = df['Review'].astype(str).fillna('')Now, to proceed further, we will add sentiment labels based on the review content. We will use the textblob library in Python for this task:
from textblob import TextBlob

# function to determine sentiment polarity
def get_sentiment(review):
    sentiment = TextBlob(review).sentiment.polarity
    if sentiment > 0:
        return 'Positive'
    elif sentiment < 0:
        return 'Negative'
    else:
        return 'Neutral'

# apply sentiment analysis
df['Sentiment'] = df['Review'].apply(get_sentiment)

sentiment_distribution = df['Sentiment'].value_counts()
Now, let’s have a look at the distribution of positive, neutral, and negative reviews:
fig = go.Figure(data=[go.Bar(
    x=sentiment_distribution.index,
    y=sentiment_distribution.values,
    marker_color=['green', 'gray', 'red'],
)])

fig.update_layout(
    title='Sentiment Distribution of ChatGPT Reviews',
    xaxis_title='Sentiment',
    yaxis_title='Number of Reviews',
    width=800,
    height=600
)

fig.show()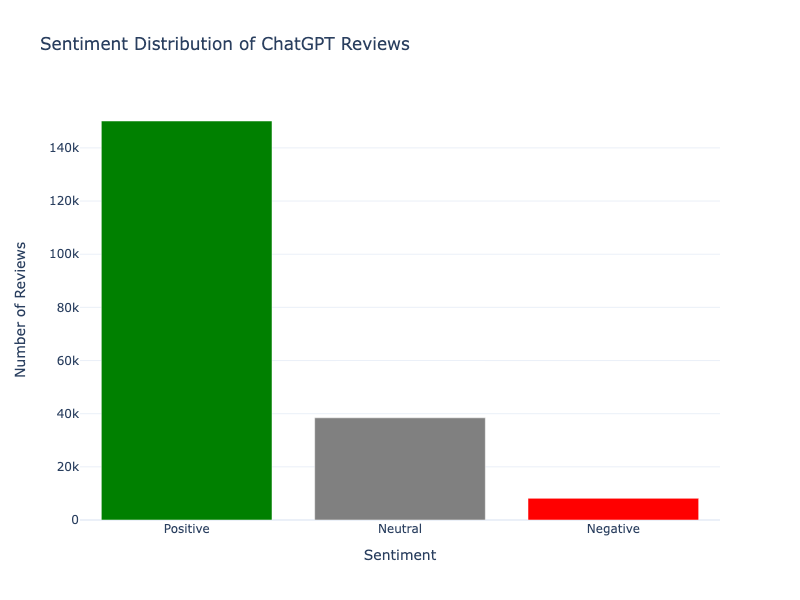
The majority of the reviews are positive, with a smaller proportion being neutral or negative. This suggests that most users have a favourable opinion of ChatGPT, though there is still a notable number of neutral and negative reviews.
Analyzing What Users Like About ChatGPT
To analyze what users like about ChatGPT, I will focus on extracting common phrases and keywords from the reviews with positive sentiments. This will help identify recurring themes or features that users appreciate.
I’ll proceed with the following steps:
- Filter the reviews that have a positive sentiment.
- Extract and analyze the most common phrases and keywords from these positive reviews.
# filter reviews with positive sentiment
positive_reviews = df[df['Sentiment'] == 'Positive']['Review']

# use CountVectorizer to extract common phrases (n-grams)
vectorizer = CountVectorizer(ngram_range=(2, 3), stop_words='english', max_features=100)
X = vectorizer.fit_transform(positive_reviews)

# sum the counts of each phrase
phrase_counts = X.sum(axis=0)
phrases = vectorizer.get_feature_names_out()
phrase_freq = [(phrases[i], phrase_counts[0, i]) for i in range(len(phrases))]

# sort phrases by frequency
phrase_freq = sorted(phrase_freq, key=lambda x: x[1], reverse=True)

phrase_df = pd.DataFrame(phrase_freq, columns=['Phrase', 'Frequency'])

fig = px.bar(phrase_df,
             x='Frequency',
             y='Phrase',
             orientation='h',
             title='Top Common Phrases in Positive Reviews',
             labels={'Phrase': 'Phrase', 'Frequency': 'Frequency'},
             width=1000,
             height=600)

fig.update_layout(
    xaxis_title='Frequency',
    yaxis_title='Phrase',
    yaxis={'categoryorder':'total ascending'}
)

fig.show()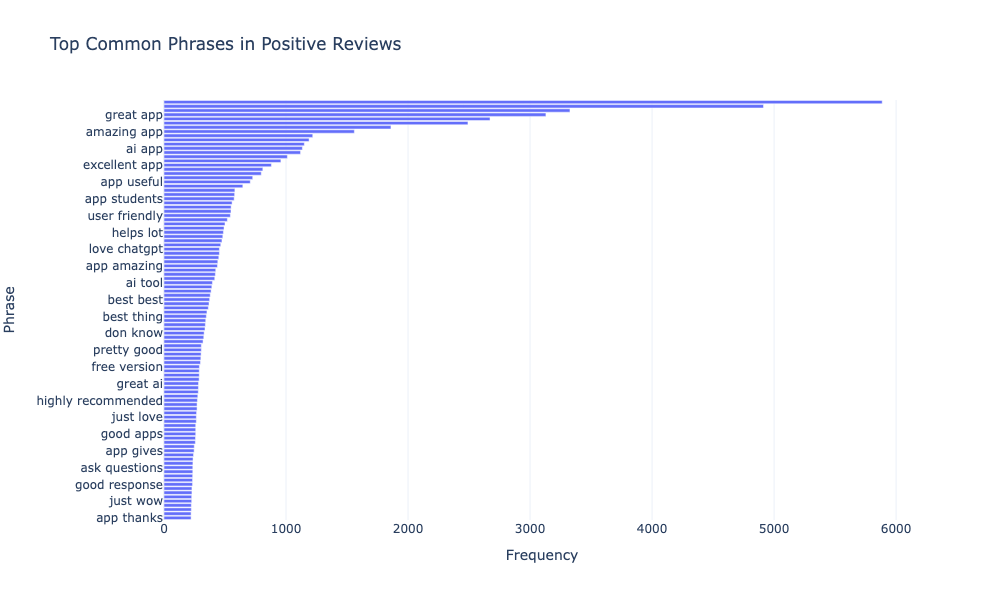
The visualization highlights that users appreciate ChatGPT for being a “great app”, with phrases like “amazing app”, “AI app”, and “excellent app” frequently mentioned in positive reviews. Users find it “useful”, “user-friendly”, and helpful for students, with many praising its AI capabilities. Additionally, the app’s ability to answer questions effectively and its free version is also valued by users.
These sentiments suggest that ChatGPT is highly regarded for its usability, educational benefits, and AI-powered features.
Analyzing What Users Don’t Like About ChatGPT
Similarly, to analyze what users don’t like about ChatGPT, I’ll focus on extracting common phrases and keywords from the reviews with negative sentiments. This will help identify recurring issues or features that users are dissatisfied with.
I’ll proceed by:
- Filtering the reviews with negative sentiments.
- Extracting and analyzing the most common phrases and keywords from these negative reviews.
# filter reviews with negative sentiment
negative_reviews = df[df['Sentiment'] == 'Negative']['Review']

# use CountVectorizer to extract common phrases (n-grams) for negative reviews
X_neg = vectorizer.fit_transform(negative_reviews)

# sum the counts of each phrase in negative reviews
phrase_counts_neg = X_neg.sum(axis=0)
phrases_neg = vectorizer.get_feature_names_out()
phrase_freq_neg = [(phrases_neg[i], phrase_counts_neg[0, i]) for i in range(len(phrases_neg))]

# sort phrases by frequency
phrase_freq_neg = sorted(phrase_freq_neg, key=lambda x: x[1], reverse=True)

phrase_neg_df = pd.DataFrame(phrase_freq_neg, columns=['Phrase', 'Frequency'])

fig = px.bar(phrase_neg_df,
             x='Frequency',
             y='Phrase',
             orientation='h',
             title='Top Common Phrases in Negative Reviews',
             labels={'Phrase': 'Phrase', 'Frequency': 'Frequency'},
             width=1000,
             height=600)

fig.update_layout(
    xaxis_title='Frequency',
    yaxis_title='Phrase',
    yaxis={'categoryorder':'total ascending'}
)

fig.show()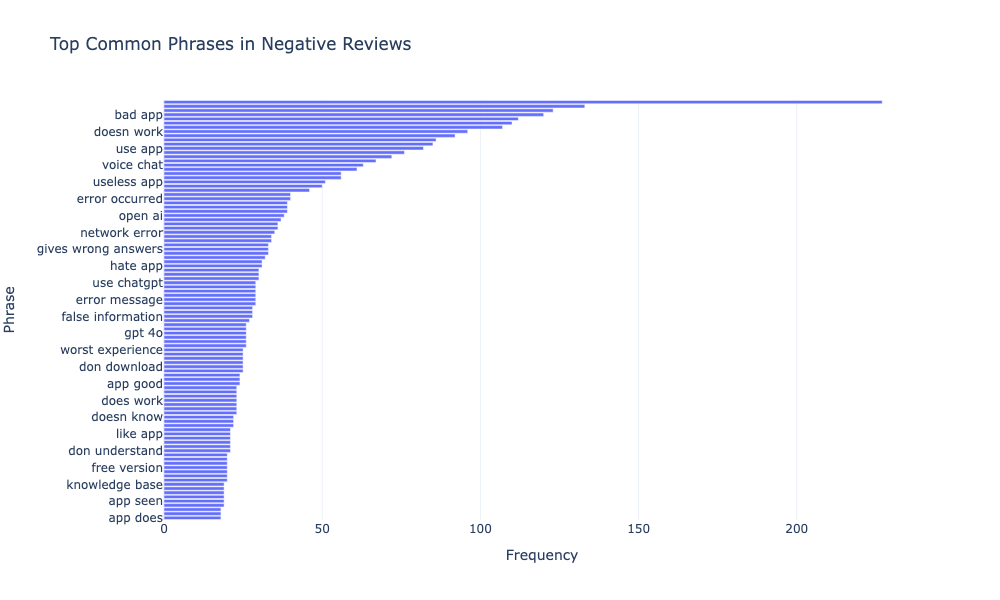
The visualization shows that users’ main complaints about ChatGPT include it being labelled as a “bad app” or “useless app”, with issues such as “doesn’t work”, “error occurred”, and “network error” frequently mentioned in negative reviews. Users also express frustration with incorrect or misleading answers, technical problems like “error messages” and difficulty using specific features like “voice chat”.
These issues suggest that users are dissatisfied with the app’s reliability, accuracy, and overall performance.
Common Problems Faced by Users in ChatGPT
To analyze common problems people face with ChatGPT, I’ll focus on the frequent phrases and keywords found in the negative reviews. I’ll categorize these phrases into broader problem areas, and then visualize the most common issues. Let’s proceed with it:
# grouping similar phrases into broader problem categories
problem_keywords = {
    'Incorrect Answers': ['wrong answer', 'gives wrong', 'incorrect', 'inaccurate', 'wrong'],
    'App Performance': ['slow', 'lag', 'crash', 'bug', 'freeze', 'loading', 'glitch', 'worst app', 'bad app', 'horrible', 'terrible'],
    'User Interface': ['interface', 'UI', 'difficult to use', 'confusing', 'layout'],
    'Features Missing/Not Working': ['feature missing', 'not working', 'missing', 'broken', 'not available'],
    'Quality of Responses': ['bad response', 'useless', 'poor quality', 'irrelevant', 'nonsense']
}

# initialize a dictionary to count problems
problem_counts = {key: 0 for key in problem_keywords.keys()}

# count occurrences of problem-related phrases in negative reviews
for phrase, count in phrase_freq_neg:
    for problem, keywords in problem_keywords.items():
        if any(keyword in phrase for keyword in keywords):
            problem_counts[problem] += count
            break

problem_df = pd.DataFrame(list(problem_counts.items()), columns=['Problem', 'Frequency'])

fig = px.bar(problem_df,
             x='Frequency',
             y='Problem',
             orientation='h',
             title='Common Problems Faced by Users in ChatGPT',
             labels={'Problem': 'Problem', 'Frequency': 'Frequency'},
             width=1000,
             height=600)

fig.update_layout(
    plot_bgcolor='white',
    paper_bgcolor='white',
    xaxis_title='Frequency',
    yaxis_title='Problem',
    yaxis={'categoryorder':'total ascending'}
)

fig.show()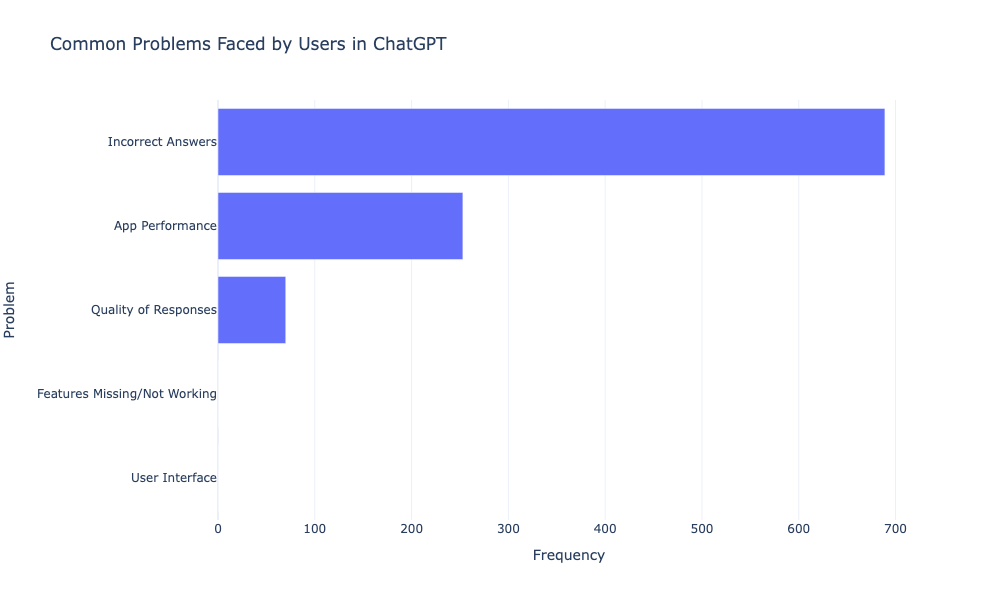
The visualization indicates that the most common problem users face with ChatGPT is receiving “Incorrect Answers”, which is the most frequent issue by a significant margin. Other notable problems include “App Performance”, where users experience issues with the app’s functionality, and concerns about the “Quality of Responses”.
These findings suggest areas where improvements could be made to enhance the user experience with ChatGPT.
Analyzing How Reviews Changed Over Time
Let’s analyze the trend of reviews now. To analyze how the reviews have changed over time, I will:
- Aggregate the reviews by their sentiment (Positive, Neutral, Negative) over time.
- Visualize the trends in the volume of each sentiment type over time.
# convert 'Review Date' to datetime format
df['Review Date'] = pd.to_datetime(df['Review Date'])

# aggregate sentiment counts by date
sentiment_over_time = df.groupby([df['Review Date'].dt.to_period('M'), 'Sentiment']).size().unstack(fill_value=0)

# convert the period back to datetime for plotting
sentiment_over_time.index = sentiment_over_time.index.to_timestamp()

fig = go.Figure()

fig.add_trace(go.Scatter(x=sentiment_over_time.index, y=sentiment_over_time['Positive'],
                         mode='lines', name='Positive', line=dict(color='green')))
fig.add_trace(go.Scatter(x=sentiment_over_time.index, y=sentiment_over_time['Neutral'],
                         mode='lines', name='Neutral', line=dict(color='gray')))
fig.add_trace(go.Scatter(x=sentiment_over_time.index, y=sentiment_over_time['Negative'],
                         mode='lines', name='Negative', line=dict(color='red')))

fig.update_layout(
    title='Sentiment Trends Over Time',
    xaxis_title='Date',
    yaxis_title='Number of Reviews',
    plot_bgcolor='white',
    paper_bgcolor='white',
    legend_title_text='Sentiment',
    xaxis=dict(showgrid=True, gridcolor='lightgray'),
    yaxis=dict(showgrid=True, gridcolor='lightgray')
)

fig.show()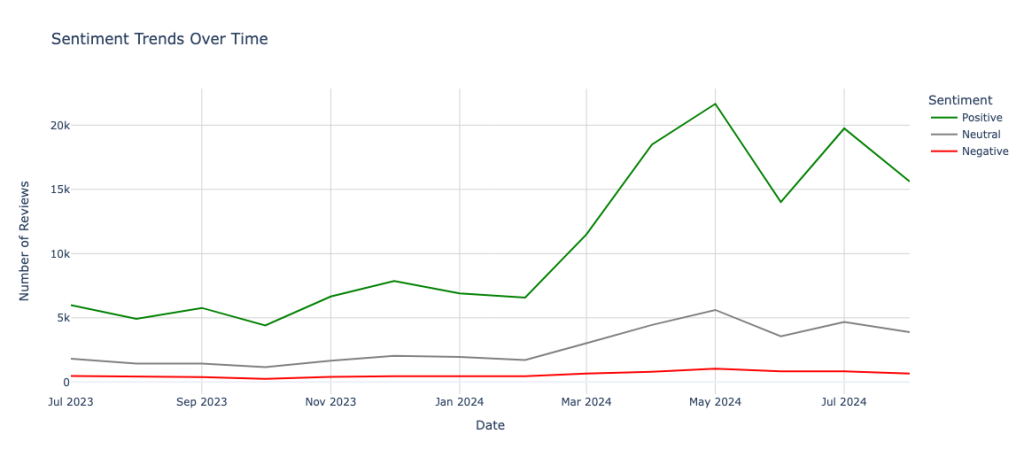
The visualization shows that the number of positive reviews (green line) for ChatGPT has generally increased over time, with a significant rise beginning around March 2024, peaking in May 2024, and then slightly declining in July 2024.
Neutral reviews (grey line) also show a gradual increase over time, with a noticeable peak around May 2024.
Negative reviews (red line) have remained relatively stable and low throughout the period, indicating that while more users are sharing their experiences over time, the overall sentiment is largely positive with a steady but minimal increase in negative feedback.
Analyzing How Often Users Promote ChatGPT
Now, to finish this task on ChatGPT reviews analysis, we will analyze how often users promote ChatGPT. We will use the concept of Net Promoter Score here. Net Promoter Score (NPS) is a commonly used metric to gauge customer satisfaction and loyalty by asking users how likely they are to recommend a product or service. Typically, NPS is calculated based on responses to the question: “How likely are you to recommend our product to a friend or colleague?” on a scale from 0 to 10. Here’s how NPS is calculated:
- Promoters: Respondents who provide a score of 9 or 10.
- Passives: Respondents who provide a score of 7 or 8.
- Detractors: Respondents who provide a score between 0 and 6.
NPS= %Promoters − %Detractors
Given the available data, I’ll assume that users who rate the app 5 stars are Promoters, those who rate it 4 stars are Passives, and those who rate it 3 stars or below are Detractors. Let’s calculate the NPS based on this assumption:
# define the categories based on the ratings
df['NPS Category'] = df['Ratings'].apply(lambda x: 'Promoter' if x == 5 else ('Passive' if x == 4 else 'Detractor'))

# calculate the percentage of each category
nps_counts = df['NPS Category'].value_counts(normalize=True) * 100

# calculate NPS
nps_score = nps_counts.get('Promoter', 0) - nps_counts.get('Detractor', 0)

# display the NPS Score
nps_score
64.35313912172705
The Net Promoter Score (NPS) for ChatGPT, based on the ratings provided in the dataset, is approximately 64.35. It indicates a strong likelihood that users would recommend ChatGPT to others, as a score above 50 is generally considered excellent.