Build Your Personal AI Data Analyst
We have all been there. You have a messy CSV file, a deadline, and a head full of questions. But instead of finding answers, you find yourself trying to remember the exact syntax to reshape a Pandas DataFrame or change the colour of a Matplotlib bar chart. What if you could just ask your data questions? Today, I’ll show you how to build your own personal AI data analyst that uses LLM to analyse data and provide you with a final answer.
Build Your Own Personal AI Data Analyst
Many Chat with your Data tools make a critical mistake: they try to make the AI answer the question directly. LLMs are bad at math. If you ask an LLM to calculate the average of 10,000 rows, it will hallucinate.
The solution is not to ask the AI to do the math. Ask the AI to write the code that does the math.
Here is the architecture we are building:
- Ingest: Load any flat file (CSV, Excel, JSON).
- Detect: Algorithmically understand the column types (Numeric vs. Categorical).
- Reason: Convert natural language (“Show me the outliers”) into Python code (df.loc[z_score > 3]).
- Execute: Run that code in a sandboxed environment and return the result.
This approach combines the linguistic power of AI with the computational precision of Python.
Prerequisites
To follow along, you need a basic Python environment. You will need the following libraries:
pip install streamlit pandas matplotlib numpy scipy openpyxl
If you want to use the local LLM features for custom queries, install Ollama and pull a model like Llama 3:
ollama pull llama3.1
Building The Brain of Our Personal AI Data Analyst
Create a file named analyst.py. This file handles the heavy lifting. It’s the engine room. We are going to break down the code provided into logical chunks.
Step 1: Robust Data Loading
Data comes in messy formats. This section ensures that whether the user uploads a pure CSV or a binary stream, we can read it:
import io
import tempfile
import subprocess
from pathlib import Path
import pandas as pd
import matplotlib.pyplot as plt
import numpy as np
import textwrap
import sys
import os

# Optional duckdb import (not required)
try:
    import duckdb
except Exception:
    duckdb = None

# ----------------- Load data -----------------
def _looks_like_csv(raw_bytes: bytes) -> bool:
    try:
        sample = raw_bytes[:1024].decode(errors="ignore")
    except Exception:
        return False
    return "," in sample and "\n" in sample

def load_data(file_or_path) -> pd.DataFrame:
    """
    Accepts Streamlit UploadedFile, path string/Path, or file-like object.
    Returns pandas DataFrame.
    """
    if isinstance(file_or_path, (str, Path)):
        p = Path(file_or_path)
        s = p.suffix.lower()
        if s == ".csv":
            return pd.read_csv(p)
        if s in {".xls", ".xlsx"}:
            return pd.read_excel(p)
        if s == ".json":
            return pd.read_json(p)
        return pd.read_csv(p)

    # file-like (UploadedFile)
    name = getattr(file_or_path, "name", None)
    suffix = Path(name).suffix.lower() if name else None
    raw = file_or_path.read()
    if isinstance(raw, str):
        raw = raw.encode("utf-8")
    bio = io.BytesIO(raw)

    if suffix == ".csv" or (suffix is None and _looks_like_csv(raw)):
        bio.seek(0); return pd.read_csv(bio)
    if suffix in {".xls", ".xlsx"}:
        bio.seek(0); return pd.read_excel(bio)
    if suffix == ".json":
        bio.seek(0); return pd.read_json(bio)
    # fallback
    bio.seek(0)
    try:
        return pd.read_csv(bio)
    except Exception:
        bio.seek(0); return pd.read_json(bio)
A good tool doesn’t complain about file formats. By checking bytes and suffixes, we make the tool just work for the end user.
Step 2: Deterministic Intelligence (Prompt Suggestions)
Before we even touch an LLM, we can be smart. We scan the DataFrame columns. If we see numbers, we suggest histograms. If we see dates, we suggest a time series:
def _detect_column_types(df: pd.DataFrame):
    numeric = df.select_dtypes(include=[np.number]).columns.tolist()
    datetime = []
    # try to infer datetime columns
    for c in df.columns:
        if np.issubdtype(df[c].dtype, np.datetime64):
            datetime.append(c)
        else:
            # try to parse small sample as date
            try:
                sample = df[c].dropna().astype(str).iloc[:20]
                parsed = pd.to_datetime(sample, errors="coerce")
                if parsed.notna().sum() >= max(1, min(5, len(sample)//2)):
                    datetime.append(c)
            except Exception:
                pass
    # categoricals: low cardinality non-numeric
    categorical = [c for c in df.columns if c not in numeric + datetime and df[c].nunique(dropna=True) <= 50]
    return {"numeric": numeric, "datetime": datetime, "categorical": categorical}

def suggest_prompts(df: pd.DataFrame, max_suggestions: int = 8):
    """
    Return a list of helpful, ready-to-run prompt strings for the dataset.
    Deterministic and works without any LLM.
    """
    types = _detect_column_types(df)
    numeric = types["numeric"]
    datetime = types["datetime"]
    categorical = types["categorical"]

    suggestions = []
    # Basic summary
    suggestions.append("Summarize the dataset in 5 bullet points (rows, columns, missing values, numeric columns, top categorical).")
    # Top value queries
    if categorical:
        col = categorical[0]
        suggestions.append(f"Show the top 10 counts for the categorical column '{col}'.")
    # Numeric summaries
    if numeric:
        suggestions.append(f"Show summary statistics (count, mean, std, min, 25%, 50%, 75%, max) for numeric columns.")
        col = numeric[0]
        suggestions.append(f"Create a histogram of the numeric column '{col}'.")
        if len(numeric) >= 2:
            suggestions.append(f"Create a scatter plot comparing '{numeric[0]}' (x) vs '{numeric[1]}' (y).")
        suggestions.append(f"Show the top 10 rows sorted by '{col}' descending.")
    # Time series
    if datetime:
        dcol = datetime[0]
        # choose a numeric for aggregation if exists
        ag = numeric[0] if numeric else None
        if ag:
            suggestions.append(f"Create a time series of monthly sum of '{ag}' using the datetime column '{dcol}'.")
        else:
            suggestions.append(f"Show counts per month using the datetime column '{dcol}'.")
    # Correlation
    if len(numeric) >= 2:
        suggestions.append("Show the correlation matrix heatmap for numeric columns.")
    # Generic top-k
    suggestions.append("Find rows that look like anomalies using z-score > 3 on numeric columns and show top 20.")
    # limit suggestions
    return suggestions[:max_suggestions]
This is Low-Tech AI. It feels intelligent to the user because the system anticipates their needs, but it’s actually just solid software engineering.
Step 3: The Translator
This is the safety layer. If the user asks for a standard summary or a correlation matrix, we don’t need an LLM. We can map that request directly to trusted, bug-free code:
def prompt_to_code(prompt: str, df: pd.DataFrame):
    """
    Convert known prompt templates into runnable python code strings.
    If the prompt is custom/unrecognized, return None (so UI can send to LLM instead).
    """
    p = prompt.strip().lower()

    # Summary
    if p.startswith("summarize the dataset"):
        code = textwrap.dedent("""
            # produce a short summary as printed text
            info = []
            info.append(f"Rows: {len(df)}, Columns: {len(df.columns)}")
            info.append("Column types: " + ", ".join([f\"{c}:{str(df[c].dtype)[:10]}\" for c in df.columns[:10]]))
            miss = df.isnull().sum().sort_values(ascending=False).head(10)
            info.append("Top missing: " + ", ".join([f\"{idx}:{val}\" for idx,val in miss.items() if val>0]))
            numeric = df.select_dtypes(include=['number']).columns.tolist()
            info.append(f\"Numeric columns count: {len(numeric)}\")
            # print concise bullets
            result = \"\\n\".join([\"- \"+i for i in info])
        """)
        return code

    # Top counts for categorical
    if "top 10 counts for the categorical column" in p or "top 10 counts" in p and "'" in p:
        # try to extract column name between quotes
        import re
        m = re.search(r"'([^']+)'", prompt)
        if not m:
            m = re.search(r'"([^"]+)"', prompt)
        col = m.group(1) if m else None
        if col:
            code = textwrap.dedent(f"""
                # top 10 counts for '{col}'
                result = df['{col}'].value_counts(dropna=False).head(10).reset_index()
                result.columns = ['value','count']
            """)
            return code

    # Summary statistics for numeric
    if "summary statistics" in p or "describe" in p:
        code = textwrap.dedent("""
            result = df.select_dtypes(include=['number']).describe().T
        """)
        return code

    # Histogram
    if p.startswith("create a histogram of the numeric column") or "histogram of the numeric column" in p:
        import re
        m = re.search(r"'([^']+)'", prompt)
        col = m.group(1) if m else None
        if col:
            code = textwrap.dedent(f"""
                # histogram for '{col}'
                plt.figure(figsize=(6,4))
                df['{col}'].dropna().astype(float).hist(bins=30)
                plt.title('Histogram of {col}')
                plt.xlabel('{col}')
                plt.ylabel('count')
                # produce an image by saving to result_img_path variable
                result_img_path = None
            """)
            # We'll return plotting code that uses plt; execution will save figure
            return code

    # Scatter plot
    if "scatter plot comparing" in p and "vs" in p:
        import re
        m = re.search(r"'([^']+)' \\(x\\) vs '([^']+)' \\(y\\)", prompt)
        if m:
            xcol, ycol = m.group(1), m.group(2)
            code = textwrap.dedent(f"""
                plt.figure(figsize=(6,4))
                df.plot.scatter(x='{xcol}', y='{ycol}')
                plt.title('{ycol} vs {xcol}')
                result_img_path = None
            """)
            return code

    # Top N rows sorted by col
    if p.startswith("show the top 10 rows sorted by"):
        import re
        m = re.search(r"by '([^']+)'", prompt)
        if m:
            col = m.group(1)
            code = textwrap.dedent(f"""
                result = df.sort_values('{col}', ascending=False).head(10).reset_index(drop=True)
            """)
            return code

    # Time series monthly sum
    if "monthly sum" in p and "using the datetime column" in p:
        import re
        m = re.search(r"sum of '([^']+)' using the datetime column '([^']+)'", prompt)
        if m:
            ag, dcol = m.group(1), m.group(2)
            code = textwrap.dedent(f"""
                tmp = df.copy()
                tmp['{dcol}'] = pd.to_datetime(tmp['{dcol}'], errors='coerce')
                res = tmp.dropna(subset=['{dcol}'])
                res = res.set_index('{dcol}').resample('M')['{ag}'].sum().reset_index()
                result = res
            """)
            return code

    # Counts per month (datetime only)
    if "counts per month using the datetime column" in p:
        import re
        m = re.search(r"datetime column '([^']+)'", prompt)
        dcol = m.group(1) if m else None
        if dcol:
            code = textwrap.dedent(f"""
                tmp = df.copy()
                tmp['{dcol}'] = pd.to_datetime(tmp['{dcol}'], errors='coerce')
                res = tmp.dropna(subset=['{dcol}']).set_index('{dcol}').resample('M').size().reset_index(name='count')
                result = res
            """)
            return code

    # Correlation heatmap
    if "correlation matrix heatmap" in p or "correlation heatmap" in p:
        code = textwrap.dedent("""
            corr = df.select_dtypes(include=['number']).corr()
            import matplotlib.pyplot as plt
            plt.figure(figsize=(6,5))
            plt.imshow(corr, cmap='viridis', aspect='auto')
            plt.colorbar()
            plt.xticks(range(len(corr)), corr.columns, rotation=90)
            plt.yticks(range(len(corr)), corr.columns)
            plt.title('Correlation matrix')
            result_img_path = None
        """)
        return code

    # Anomaly detection using z-score
    if "anomalies" in p and "z-score" in p:
        code = textwrap.dedent("""
            from scipy import stats
            num = df.select_dtypes(include=['number']).dropna()
            if num.shape[1]==0:
                result = pd.DataFrame()
            else:
                z = np.abs(stats.zscore(num.select_dtypes(include=['number'])))
                mask = (z > 3).any(axis=1)
                result = df.loc[mask].head(20).reset_index(drop=True)
        """)
        return code

    # Unknown / custom prompts -> return None
    return None
Step 4: The Execution Engine
This is the key part of our code. We take the string of code, execute it, and capture the output (text or image):
def run_code(df: pd.DataFrame, code: str):
    """
    Execute code string in a restricted local namespace.
    Returns a dict:
      - {"type":"text","output":...}
      - {"type":"dataframe","df": pandas.DataFrame}
      - {"type":"image","path": path_to_png}
    Execution conventions:
      - If code sets a variable `result` to a DataFrame or string, we return it.
      - If code uses matplotlib to plot, we save the current figure to a temp PNG and return image.
      - If code raises, return error text.
    """
    # prepare namespace
    local_ns = {"pd": pd, "np": np, "df": df, "plt": plt}
    # capture prints
    old_stdout = sys.stdout
    stdout_buf = io.StringIO()
    sys.stdout = stdout_buf
    try:
        # run
        exec(code, {}, local_ns)
        # first, if plotting occurred (plt has a current figure), save it
        # If code created result_img_path variable, prefer it
        if "result_img_path" in local_ns and local_ns["result_img_path"]:
            path = local_ns["result_img_path"]
            return {"type": "image", "path": path}
        # check for figure in plt
        figs = plt.get_fignums()
        if figs:
            with tempfile.NamedTemporaryFile(delete=False, suffix=".png") as f:
                plt.savefig(f.name, bbox_inches="tight", dpi=150)
                plt.close("all")
                return {"type": "image", "path": f.name}
        # check for result variable
        if "result" in local_ns:
            res = local_ns["result"]
            if isinstance(res, pd.DataFrame):
                return {"type": "dataframe", "df": res}
            else:
                return {"type": "text", "output": str(res)}
        # otherwise, return captured stdout
        out = stdout_buf.getvalue().strip()
        if out:
            return {"type": "text", "output": out}
        return {"type": "text", "output": "Execution finished. No result produced."}
    except Exception as e:
        return {"type": "text", "output": f"Execution error: {e}"}
    finally:
        sys.stdout = old_stdout
Step 5: The LLM Connector
If the user asks a unique question (like “Calculate the moving average of Sales”), the deterministic rules won’t work. We send the schema to Ollama (a local LLM runner) and ask it to write the Python code:
def ask_llm(prompt: str, model: str = "llama3.1", timeout: int = 60) -> str:
    """
    Send prompt to local Ollama via CLI. Returns stdout text.
    If ollama is not installed or fails, returns an error string starting with [LLM...].
    Expect the model to return code inside ```python blocks.
    """
    try:
        proc = subprocess.run(["ollama", "run", model], input=prompt.encode("utf-8"),
                              stdout=subprocess.PIPE, stderr=subprocess.PIPE, timeout=timeout)
        out = proc.stdout.decode("utf-8", errors="replace")
        err = proc.stderr.decode("utf-8", errors="replace")
        if not out and err:
            return f"[LLM-error] {err}"
        return out
    except FileNotFoundError:
        return "[LLM-missing] ollama not found on PATH."
    except Exception as e:
        return f"[LLM-failed] {e}"
Building The Interface for Our Personal AI Data Analyst
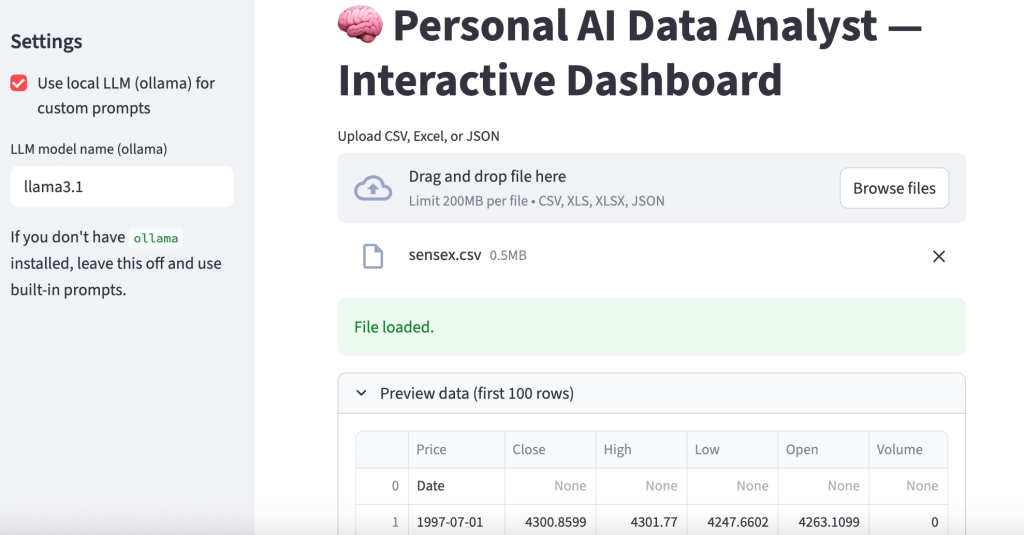
Now, create a file named app.py. We will use Streamlit for the frontend. It allows us to build a data dashboard in pure Python without knowing HTML or CSS:
import streamlit as st
from analyst import load_data, suggest_prompts, prompt_to_code, run_code, ask_llm
import pandas as pd
st.set_page_config(page_title="Personal AI Data Analyst", layout="wide")
st.title("🧠 Personal AI Data Analyst — Interactive Dashboard")
st.sidebar.header("Settings")
use_llm = st.sidebar.checkbox("Use local LLM (ollama) for custom prompts", value=False)
llm_model = st.sidebar.text_input("LLM model name (ollama)", value="llama3.1")
st.sidebar.markdown("If you don't have `ollama` installed, leave this off and use built-in prompts.")
uploaded = st.file_uploader("Upload CSV, Excel, or JSON", type=["csv","xls","xlsx","json"])
if uploaded is None:
st.info("Upload a CSV / XLSX / JSON to get started. Suggestions will appear automatically.")
st.stop()
# Load data
try:
df = load_data(uploaded)
except Exception as e:
st.error(f"Failed to load file: {e}")
st.stop()
st.success("File loaded.")
with st.expander("Preview data (first 100 rows)"):
st.dataframe(df.head(100))
# Generate suggestions
suggestions = suggest_prompts(df)
st.markdown("## Suggested analyses (pick one or write your own)")
col1, col2 = st.columns([3,1])
with col1:
selected = st.selectbox("Choose a suggested prompt", options=suggestions)
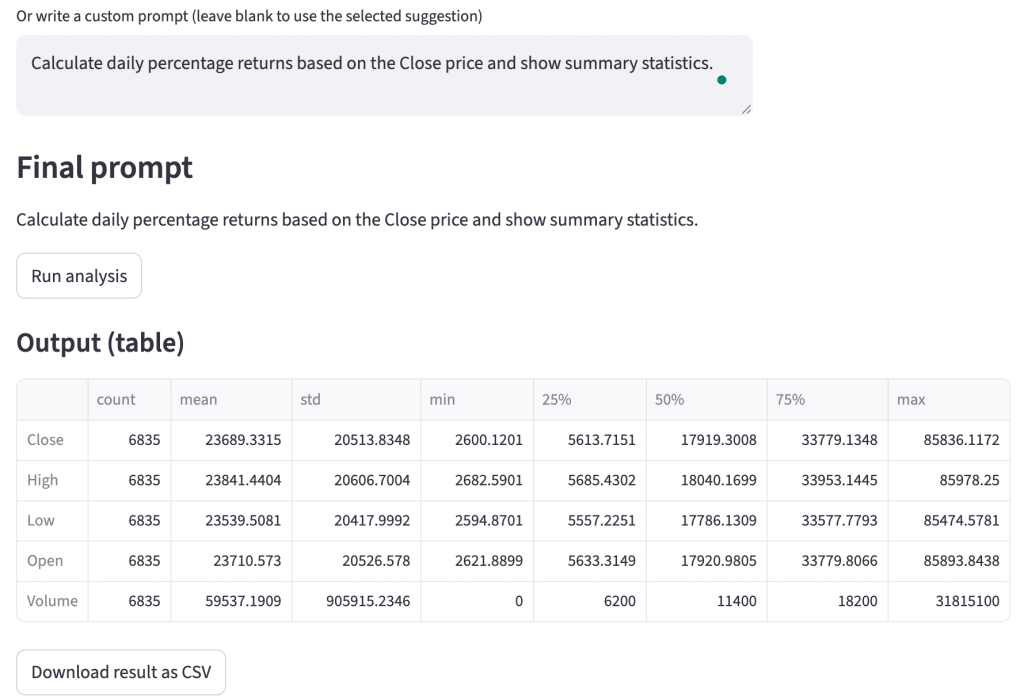
custom = st.text_area("Or write a custom prompt (leave blank to use the selected suggestion)", height=80)
with col2:
st.markdown("**Quick actions**")
if st.button("Show suggestions again"):
st.write(suggestions)
# Determine final prompt
final_prompt = custom.strip() if custom and custom.strip() else selected
st.markdown("### Final prompt")
st.write(final_prompt)
# Run button
if st.button("Run analysis"):
with st.spinner("Running..."):
# First try deterministic conversion
code = prompt_to_code(final_prompt, df)
if code:
res = run_code(df, code)
else:
# No deterministic code found. If user requested LLM, send the prompt.
if use_llm:
# craft a system instruction that asks for python in a ```python``` block that uses df, pd, plt
system = (
"You are a helpful data analyst and will respond with Python code only.\n"
"You must return code inside a ```python ... ``` block. The DataFrame is named `df`.\n"
"Use pandas for data manipulation and matplotlib for charts. Do not import heavy libs.\n"
"If returning a chart, produce matplotlib code that draws the figure (no show()) and nothing else.\n"
)
raw = system + "\n# User prompt: " + final_prompt
llm_out = ask_llm(raw, model=llm_model)
if llm_out.startswith("[LLM-missing]") or llm_out.startswith("[LLM-"):
st.warning("LLM unavailable or returned an error. Falling back to built-in behavior is not possible for this custom prompt.")
st.write(llm_out)
st.stop()
# attempt to extract python block
if "```python" in llm_out:
try:
code = llm_out.split("```python")[1].split("```")[0]
res = run_code(df, code)
except Exception as e:
st.error(f"Failed to execute code from LLM: {e}")
st.write(llm_out)
st.stop()
else:
st.error("LLM did not return a python code block. Showing raw LLM output:")
st.write(llm_out)
st.stop()
else:
st.error("This is a custom prompt that the app cannot deterministically convert to code. Enable 'Use local LLM' in the sidebar to let a local model generate Python, or edit your prompt to match one of the suggested patterns.")
st.stop()
# Display result
if res["type"] == "text":
st.markdown("#### Output (text)")
st.text(res["output"])
elif res["type"] == "dataframe":
st.markdown("#### Output (table)")
st.dataframe(res["df"])
# Provide CSV download
csv = res["df"].to_csv(index=False).encode("utf-8")
st.download_button("Download result as CSV", data=csv, file_name="result.csv", mime="text/csv")
elif res["type"] == "image":
st.markdown("#### Output (chart)")
st.image(res["path"], use_column_width=True)
else:
st.write("Unknown result type", res)Now, open your terminal and run:
streamlit run app.py
A local web server will start, and your default browser will open the application. Upload a CSV file (like a Titanic dataset or your monthly expenses), and watch the system generate questions for you automatically. Below is a sample output:
Here’s an example of a query with a custom prompt:
Why This Matters for You
In the world of Data Science, there is a fear that AI will replace analysts. This project demonstrates why that is unlikely. AI doesn’t know what makes sense contextually; it just predicts tokens. By building this tool, you aren’t being replaced; you are becoming the architect.
By building this Personal AI Data Analyst, you are moving from the person who types the code to the person who designs the system that writes the code. This shift allows you to focus on the why of the data, the business logic, the bias, and the implications, rather than the syntax of the plot.
I hope you liked this article on how to build your own personal AI data analyst that uses LLM to analyse data. Follow me on Instagram for many more resources.